Research topics
Dynamics of semiconductor nano structures
We study dynamical properties and noise of semiconductor nano structures, mainly quantum dot lasers and amplifiers. This is a very wide activity that spans from fundamental phenomena to applied topics, mainly related to photonic aspects of telecom and datacom.
Quantum Optics in room temperature ensembles of quantum dots
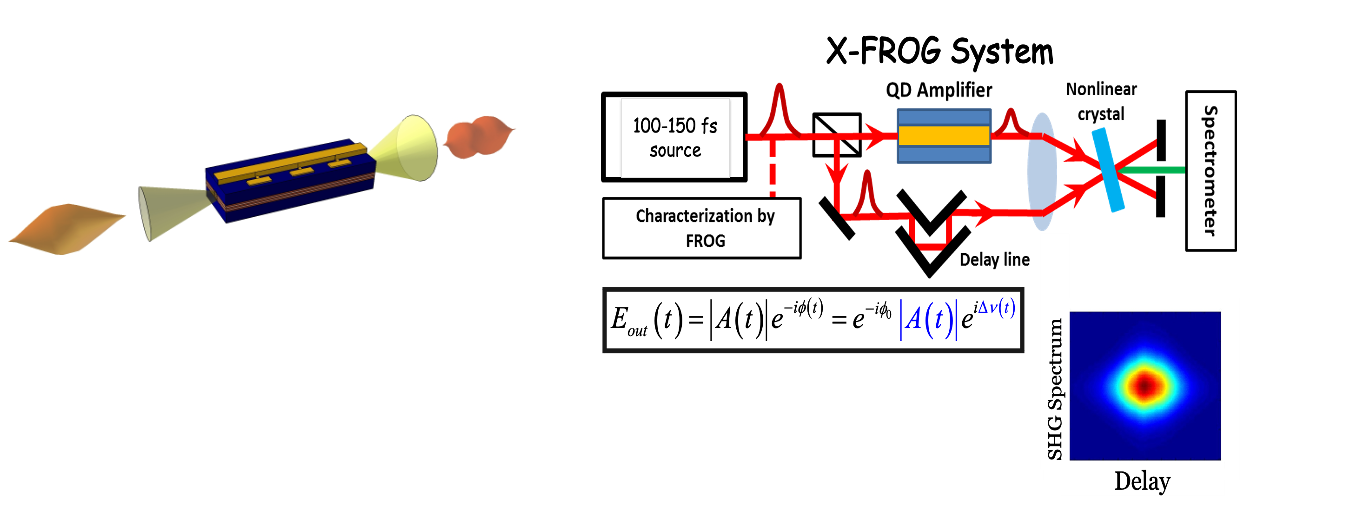
The use of short pulse excitations together with an ultra-fast characterization technique together with detailed modeling enables to induce and observe quantum coherent phenomena in quantum dot ensembles, in the form of optical amplifiers, operating at room temperature and driven by an electrical bias. The ultrafast measurements make use of frequency resolved optical gating (FROG) or aa variation of it (X-FROG). A schematic of an X-FROF system is shown below.
A large number of quantum coherent experiments have been demonstrated. They are detailed, together with a description of the comprehensive model of the coherent interactions, in the review paper Appl. Physics Review, 6, 041317 (2019). Highlight of the various coherent experiments are described hereon.
1. Excitation pulse area dependence of Rabi oscillations.
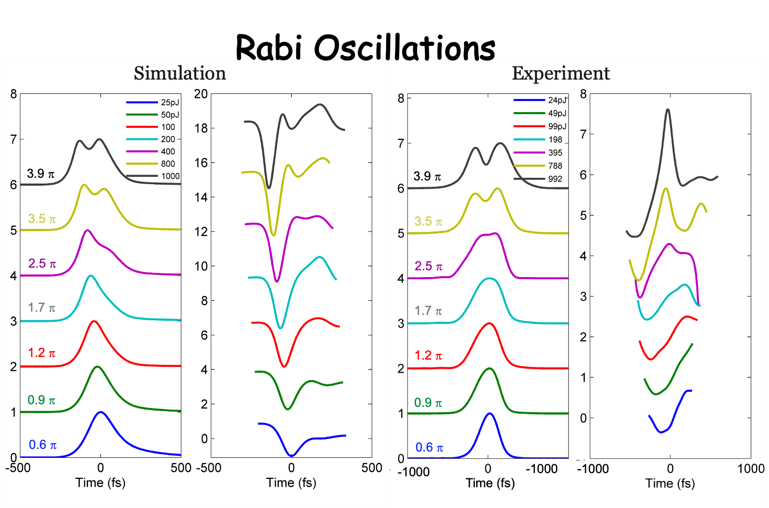 As the input pulse area increases, the output pulse amplitude changes into a two-humps structure representing changes from gain to loss and back to gain during the pulse itself. For a larger pulse area, the Rabi frequency increases so that the first Rabi flop occurs earlier. The same information is contained in the instantaneous frequency profile.
2. Coherent control of Rabi oscillations
The nature of the RBI oscillations was found to depend on the complex electric field of the excitation pulse and can hence be controlled by pulse shaping using a spatial light modulator.
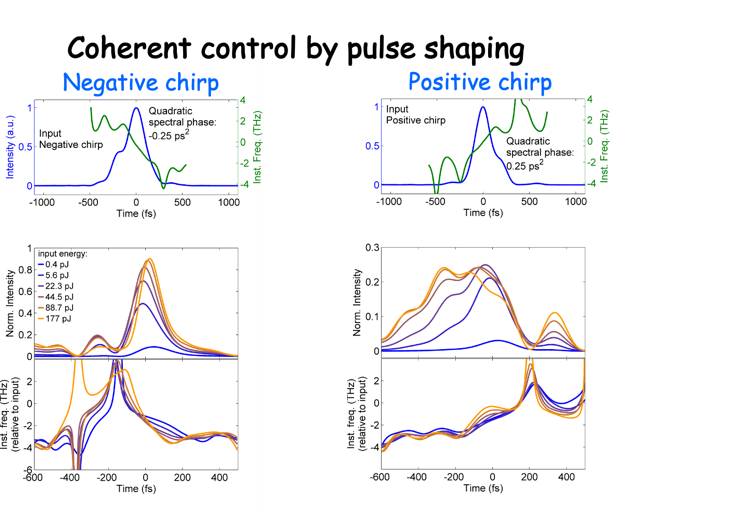
A typical result is shown here. For a pulse whose central spectrum lies on the high energy side of the gain peak, a negative linear chirp eliminates the Rabi oscillations while a positive chirp enhances them significantly. The situation is reversed when the pulse lies on the low energy side of the gain peak. More complex chirp profiles enable complicated structures of the output pulse which undergoes Rabi flops.
3. Ramsey fringes
The phenomenon of Ramsey fringes is related to Ramsey fringes except that it uses two pulses, one to induce the coherent interaction and one to probe it at variable delays following the excitation.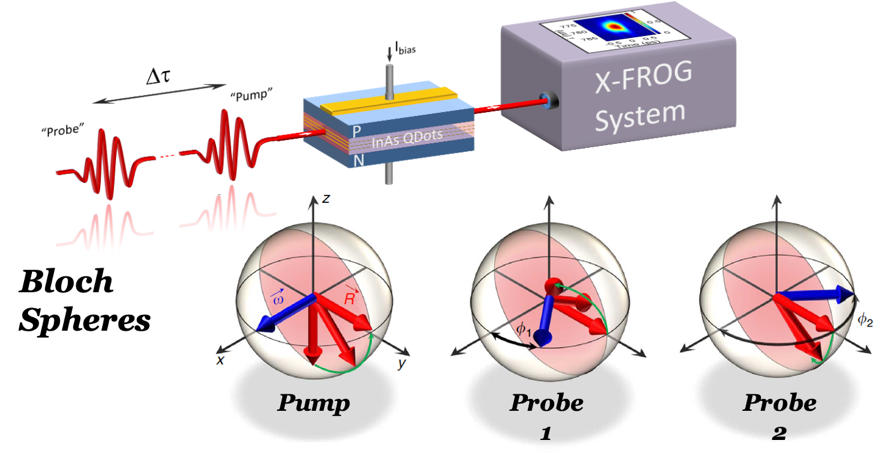 The experimental set up for observing Ramsey fringes is described on the left. The delay between the two pulses can be controlled with a resolution below 1 fs. Each pulse is measured using the X-FROG system. A typical result for a nominal delay of 600 fs is shown below.
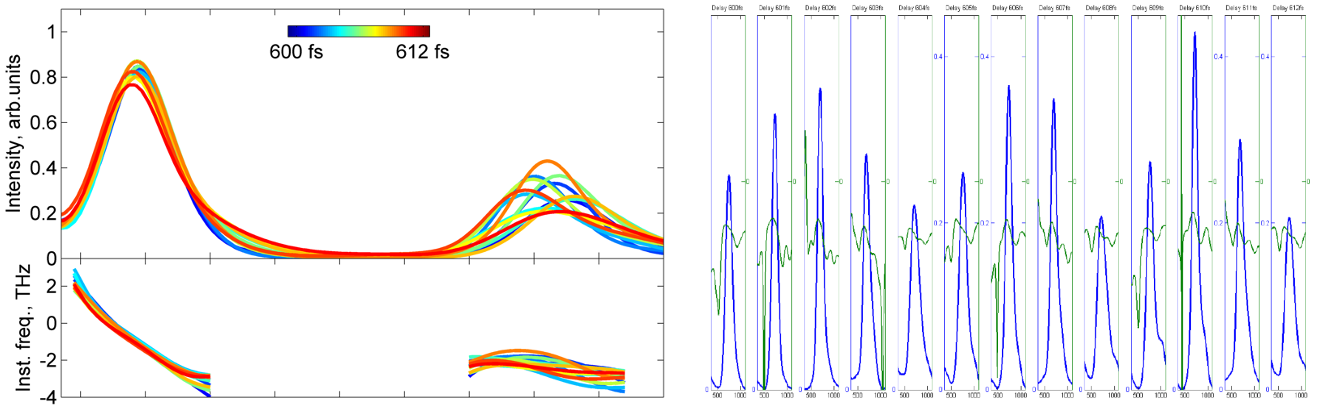
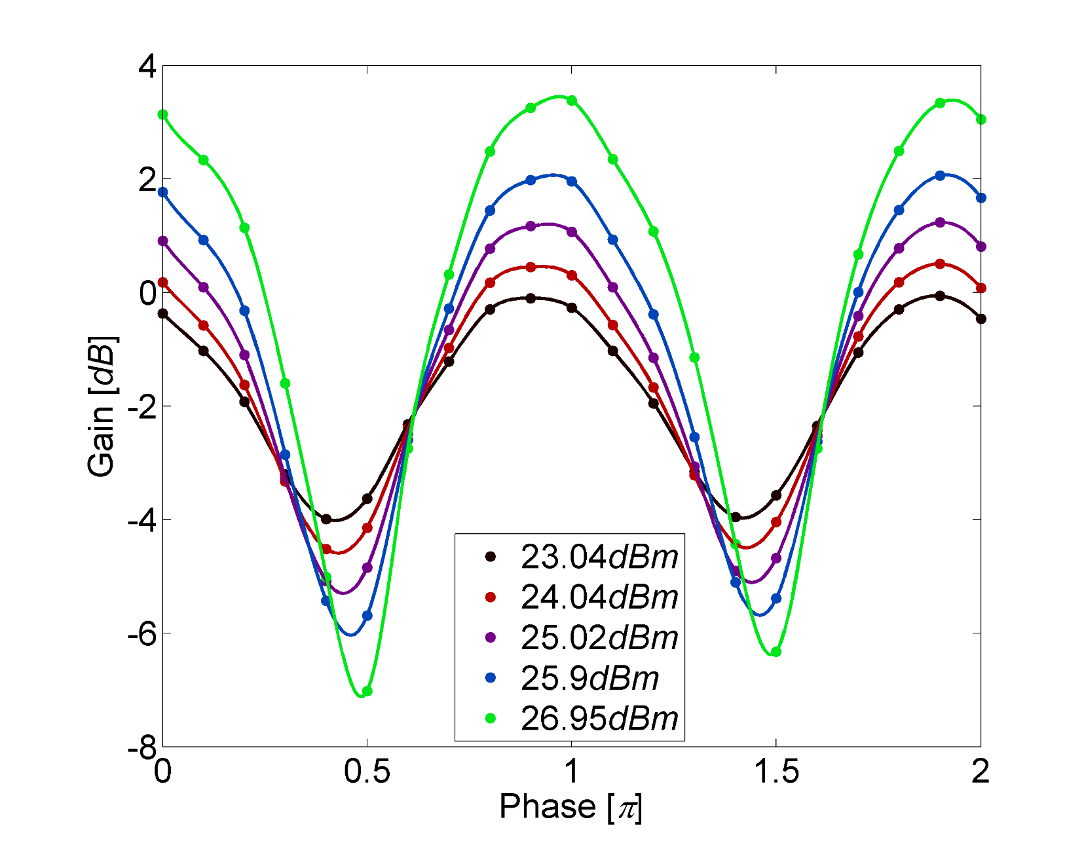
The first pulse is basically independent of the delay, but the second pulse oscillates in amplitude and position. The amplitude oscillates at the optical frequency (a single cycle at 1550 nm amounts to 5.5 fs), the picture on the right shows that the instantaneous frequency profile also repeats itself with the same periodicity. The oscillation in position result from the coupling between the real and imaginary parts of the QD susceptibility.
4. Photon echo
Photon echo is the optical analogue of spin echo. Its principle is descried below.
Starting from the gain regime (north pole on the Bloch sphere, a p/2 pulse transforms the state to the equator. In an inhomogeneous medium such as a QD ensemble, each frequency component accumulates a different phase as the state processes. When a p pulse is injected, the system reverses itself, all traces of the inhomogeneity are removed, and an echo pulse appears spontaneously. Since the time of the echo is predictable, it is possible to inject a signal at the right instant and get an induced photon echo which has a better SNR compared to its spontaneous counterpart.
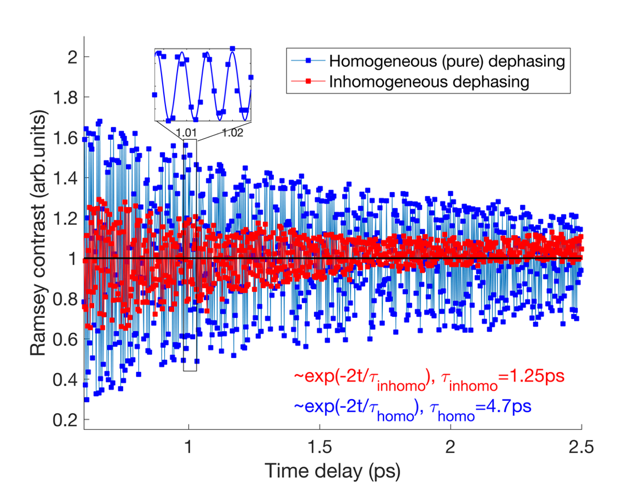 between the coherence time (which is dictated by the inhomogeneity) and the dephasing time, which is the fundamental QD parameter. Results of the two experiments are described on the left. The photon echo (blue trace) prolongs the characteristic decay time significantly. It yields the dephasing time of 4.7 ps which can increase to 5.2 ps at a lower bias. The decoherent time (red trace) is 1.25 ps, determined by the gain inhomogeneity.
5. Quantum coherent revival
Quantum coherent revival (QCR) is one of the hallmark phenomena in quantum optics. It was predicted in the 1980’s and demonstrated since the 1990’s in many media but not ion solids and not at room temperature. Using the Ramsey set up and observing the fringes for very long delays, up to 15 ps, we have demonstrated QCR in the room temperature QD amplifier. The figure below shows the CQR observation. The Ramsey contrast decays first at a rate determined by the coherence time. At later times, the coherence revives, and the Ramsey fringes reappear four more times up to 15 ps. Each revival contains oscillations at the optical frequency (with a period of 5.2 fs) and in between the revivals there is noise.
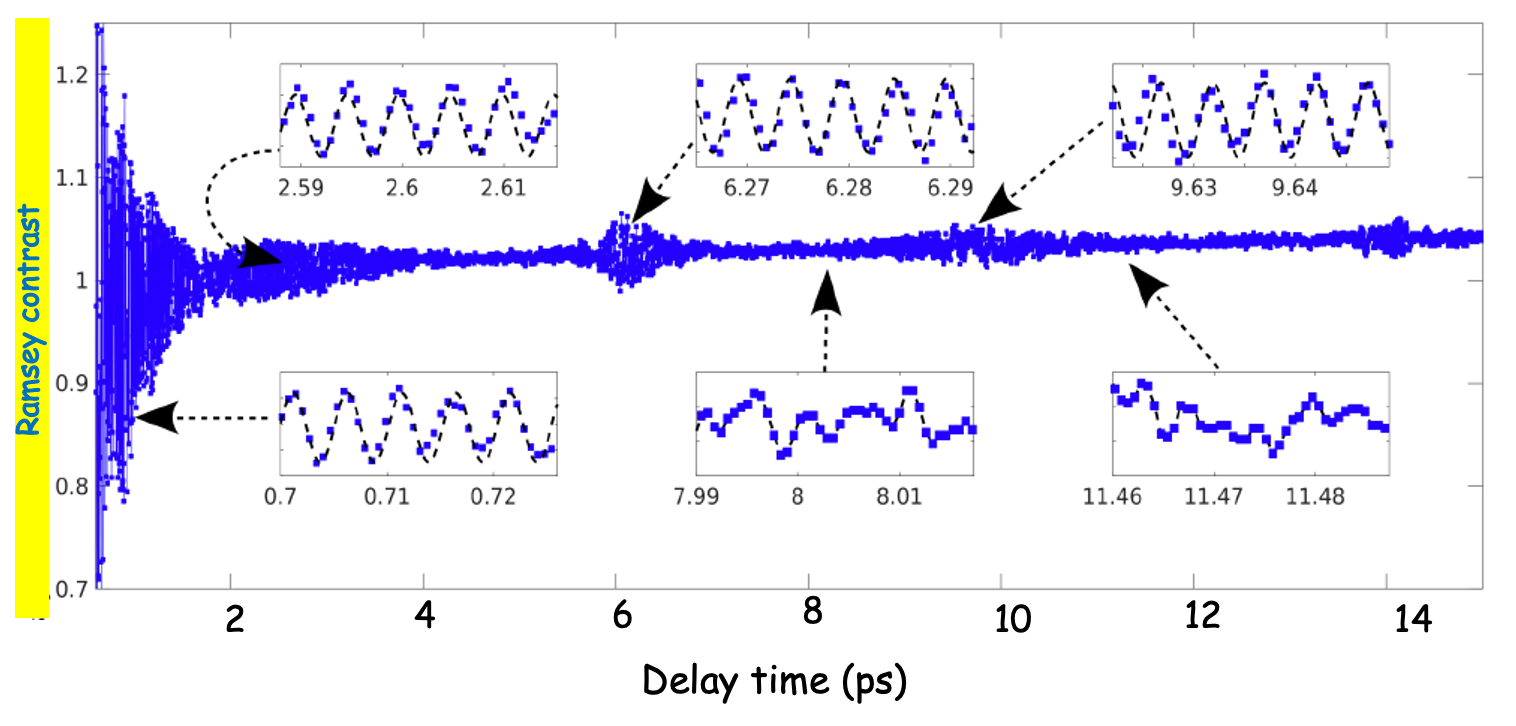
The revivals stem from the fact that the excitation pulse induces coherence on several QD groups each with a spectral width of the homogeneous linewidth. These modes interfere and yield the revivals. The modes can be calculated from the model, it turns out that in the present experiment, the number of modes is five. Controlling the excitation pulse modifies the mode collection and therefor the revival pattern changes in a controllable manner. The simplest pulse control is the change of amplitude, a series of experiments with different pulse powers and two bias levels is demonstrated in the figure below.
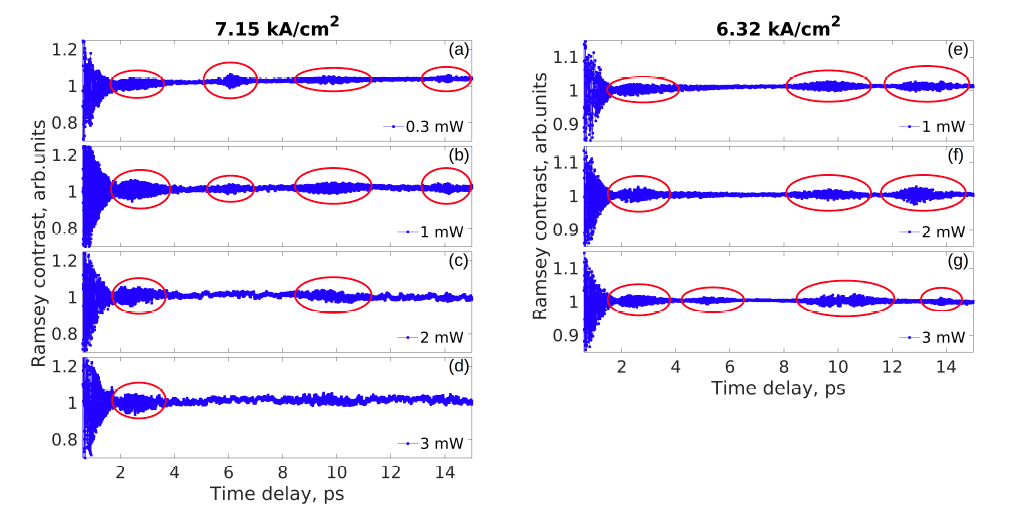
More sophisticated pulse control that includes phase manipulation will definitely yield more complex revival patterns. This experiment is ongoing.
6. Multi wavelength ultrafast dynamics of QD gain media
QD gain media are always inhomogeneously broadened since the QDs are grown in a self-assembled process. The various region within the spectrum are coupled to each other by a complex mechanism which involves coupling It is important therefore to characterize the dynamics across the spectrum, a technique is needed by which the spectrum is perturbed by a short pulse at some wavelength and the response is probed at all other wavelengths. We employ a special technique by which the probe is a tunable CW signal which is sampled by a replica of an ultrashort pump pulse. The experimental system is described below.
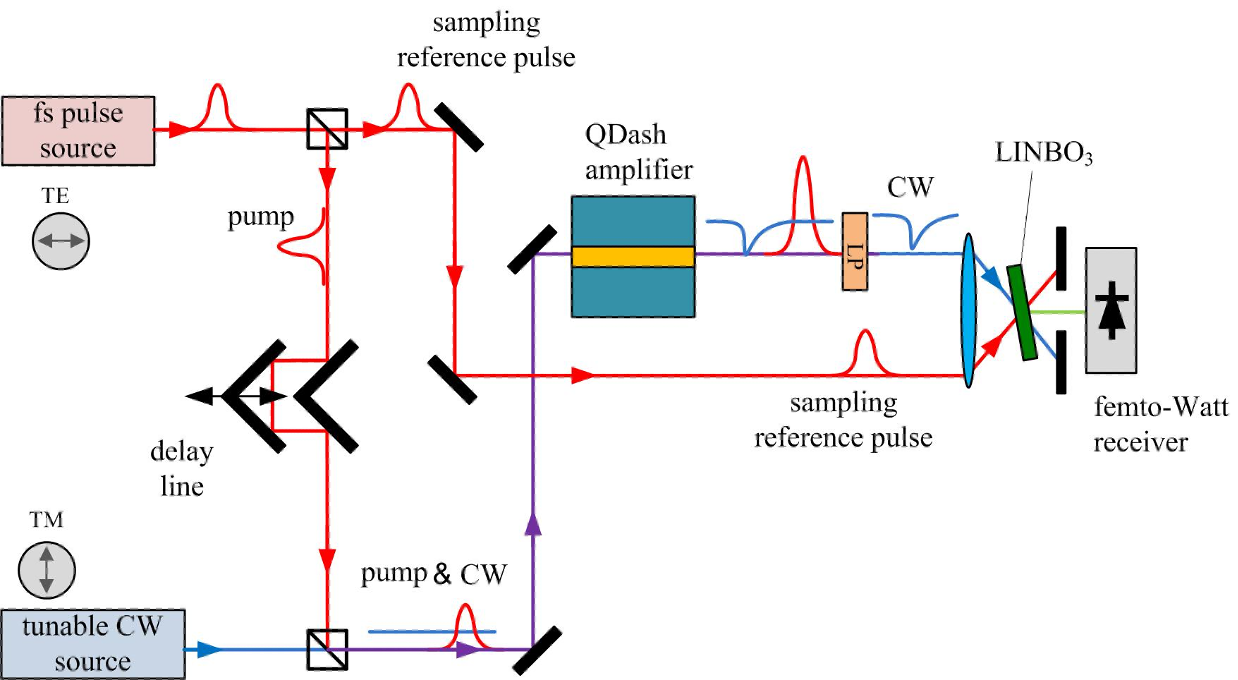
This set up serves as the main tool for many experiments. An example is given below. It shows the bias and spectrally dependent response of a tunneling injection QD amplifier.
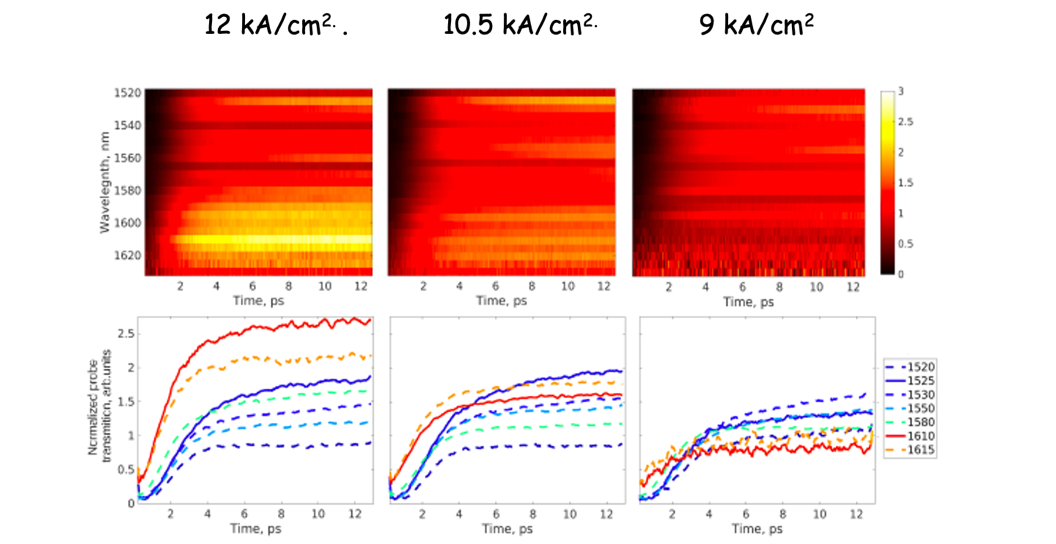
For each bias, the upper figures show, in a color code, the response across the entire range of 1520-1620 nm. The lower curves show the temporal evolution of a subset of the probe wavelengths.
Quantum dot lasers and amplifiers
Quantum dot (QD) lasers have many potential advantages over their higher dimensionality counterparts due to their tight three-dimensional carrier confinement. The problem of practical QD lasers lies in the fact that the dots are self-assembled species and hence have a distribution of sizes which makes the gain inhomogeneously broadened and this in turn humpers laser performance. In the past few years, there have been tremendous advances in QD epitaxy grown in the InP material system which emit in the telecom wavelength range near 1550 nm. These are the first QD materials that enable an almost atom-like optical gain medium and this has numerous consequences on device performance. Several highlight results of such lasers are described below.
1. QD material properties
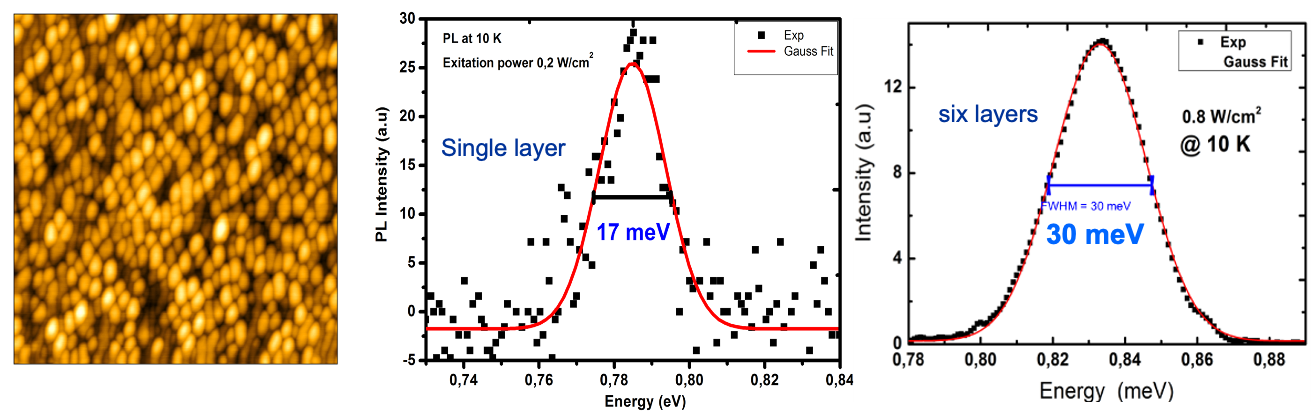
The homogeneity of a QD ensemble is characterized, by convention, by the PL linewidth at 10 K. The QD used in all Technion experiments exhibit very high densities, ( and a narrow PL spectrum. The figure below shown an AFM image of a single dot layer as well as the PL of a single layer and of a stack of 6 layers.
2. Low temperature sensitivity of QD lasers
Typical static temperature dependent L-I characteristics are shown below
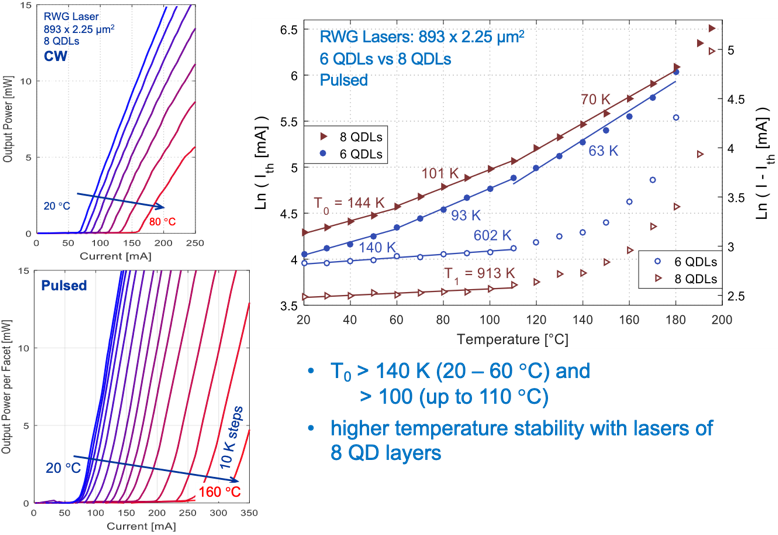
The low temperature sensitivity is very clear with very large T0 values and even more impressive, unprecedented T1 values which are above 900 K.
3. High temperature QD amplifiers
QD amplifiers are known to allow multi wavelength amplification with no cross talk. An example is shown on the left where two channels, each at – 6dBm, separated by 1 nm were amplified.
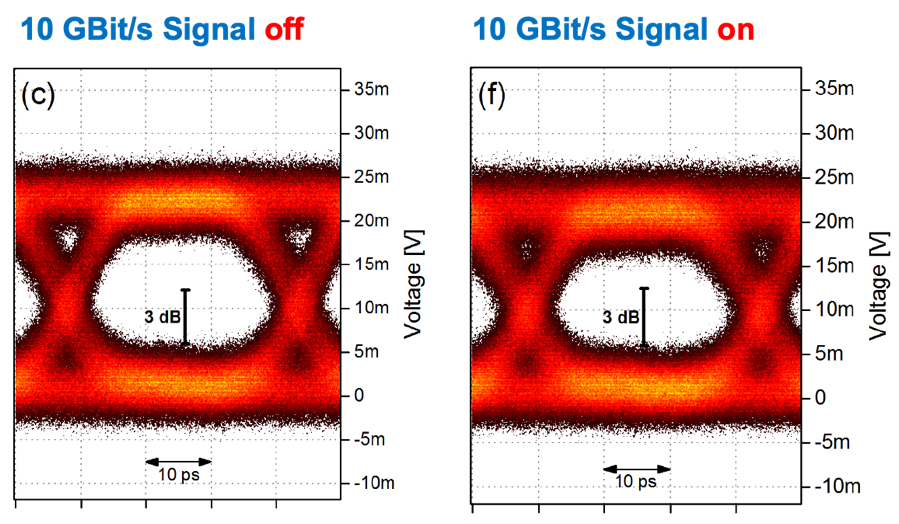 One channel was modulated at 10 Gbit/s and the second at 28 Gbit/s. The 28 Gbit/s channel is filtered out at the output and measured with 10 Gbit/s being on or off. There is virtually no difference between the two 28 Gbit/s eye patterns testifying to the fact that indeed the amplifier induced no cross talk on the two channels.
4. High speed QD lasers
The dynamical properties of QD lasers include high speed capabilities also under high temperature operation.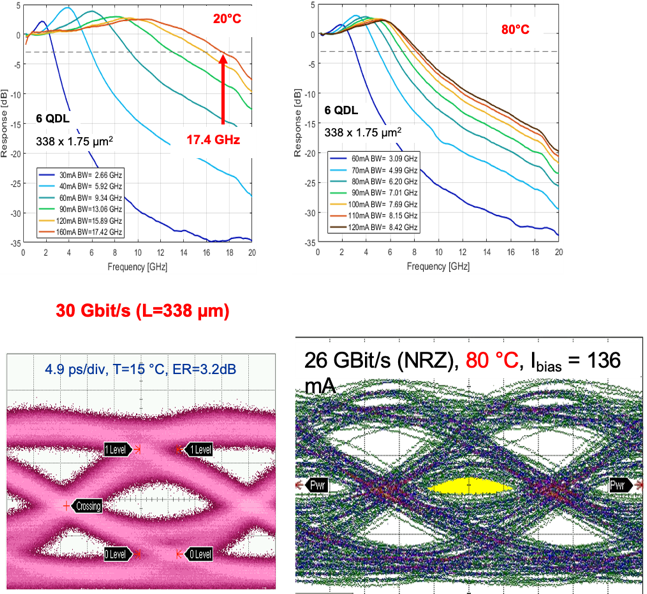
Small and large signal modulation experiments, also at elevated temperatures are shown on the left.
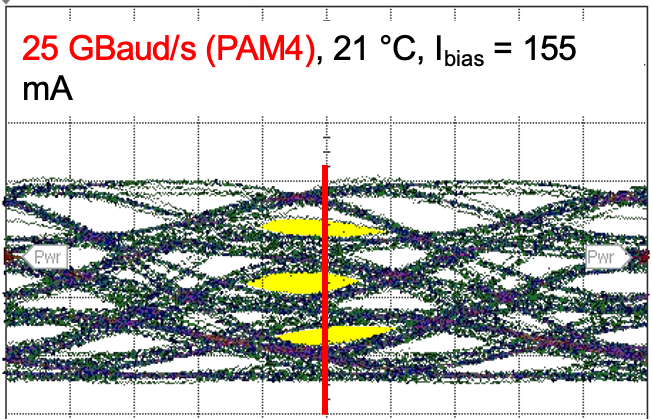
It is also possible to modulate these lasers in the PAM 4 format as shown below.
Another important dynamical property of QD lasers is the ability to modulate in large signal, at bit rates which are much higher than the bit rate predicted by small signal modulation. 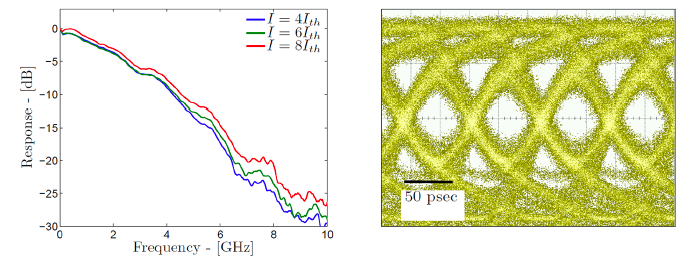 An extreme example is shown on the left where a GaAs based QD laser with a bandwidth of 2 GHz was modulated at 8.5 Gbit/s.
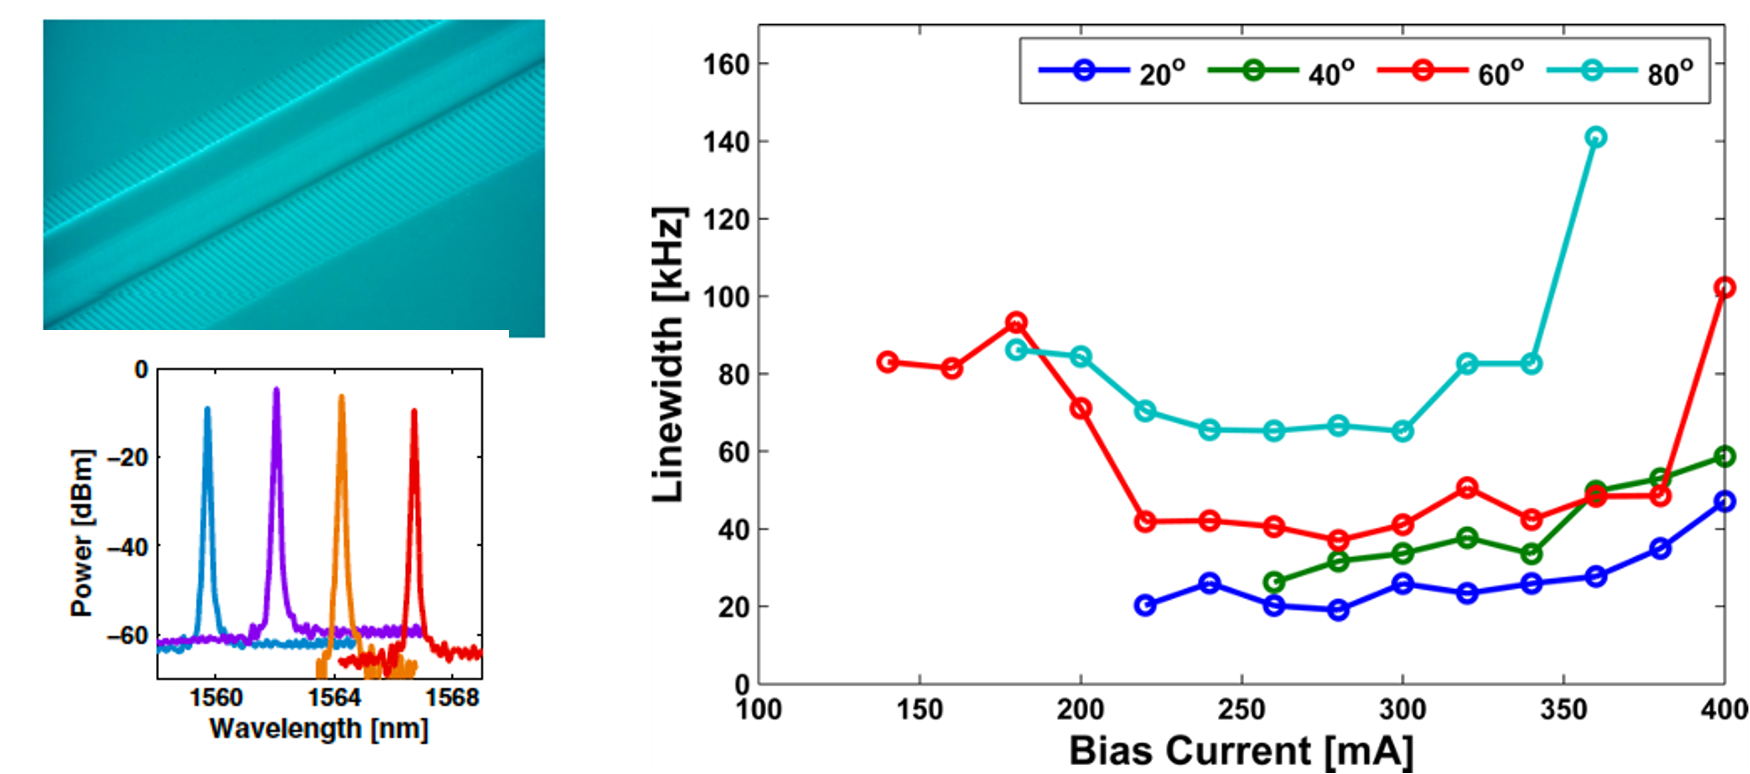
5. Narrow linewidth QD DFB lasers
The atom-like character of the highest quality QD material together with the high density leads to a very low a parameter due to the symmetric gain spectrum which is a consequence of the homogeneity. Additionally, the high density and the large energy separation between the ground and the excited states minimizes carrier escape which also enhances the gain spectrum symmetry. This leads to record linewidth for a solitary DFB chip without any external feedback. The figure below shows an SEM image of the DFB laser with a surface grating, a temperature dependent spectrum with a very large SMSR and the temperature dependent linewidth which is 20 kHz at 200C and only 80 kHz at 800C.
Dual comb spectroscopy and opto atomic clocks
Dual comb spectroscopy makes use of two pulsed sources, one is a commercial high-quality comb and the second is a semiconductor pulsed laser whose pulse is to be characterized.
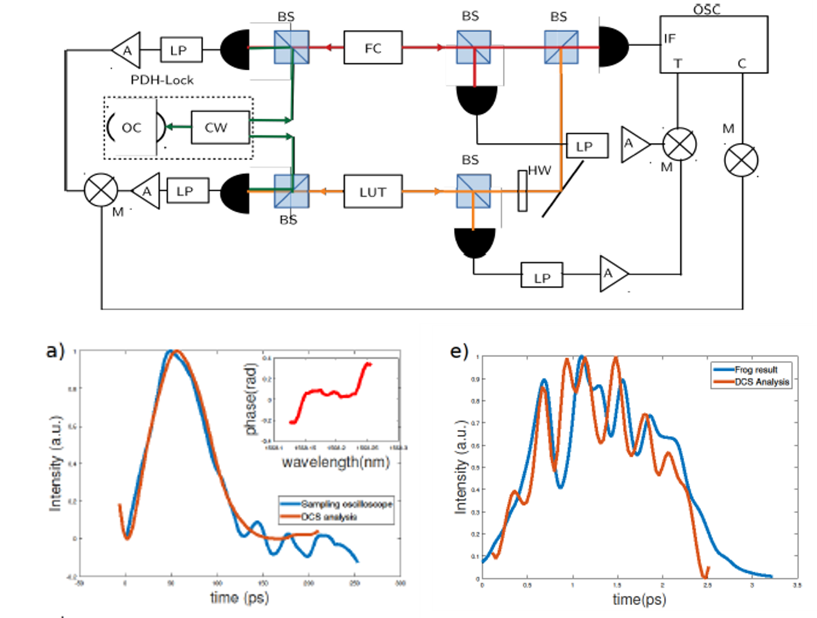
The experimental set up is shown below together with two examples. One example compares the measurements of a 50 ps pulse using a detector and a fast oscilloscope with the result of the dual comb spectroscopy system The fit is superb. The second example compares the measurement of a few ps pulse. Here the comparison is with a FROG system. Once more the fit is very good.
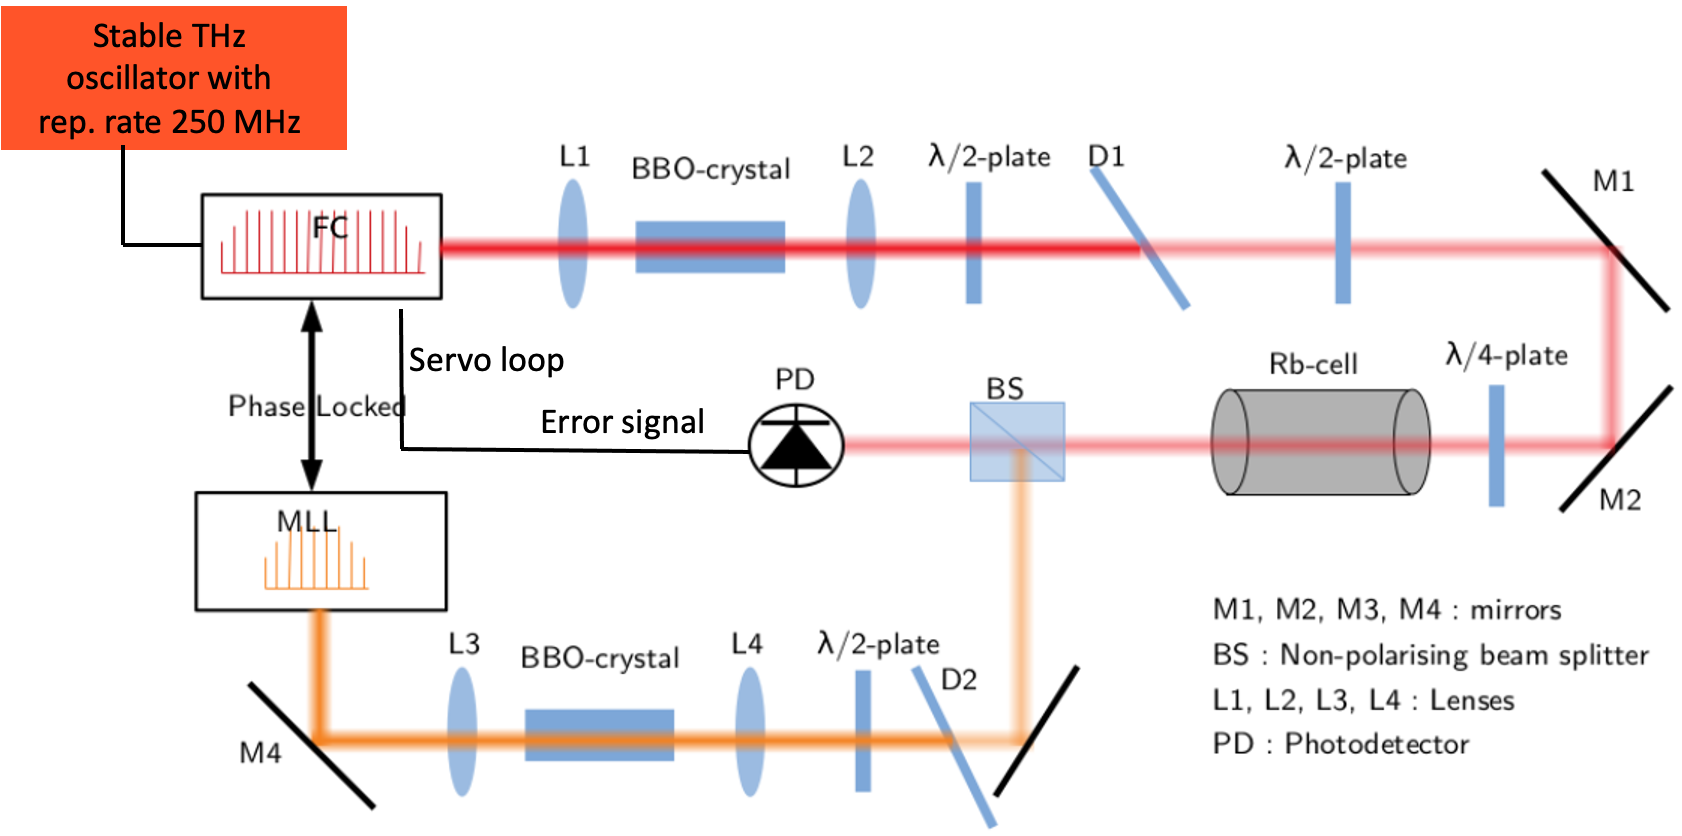
The dual comb spectroscopy principle is also used as the basis for an opto-atomic clock. The long-term stability of the clock is obtained by employing CPT, the atomic transition used in chip scale atomic clocks. CPT requires two spectral lines separated by 6.8 GHz. The opto atomic clock uses to lines of the commercial comb whose line separation is nominally 250 MHz but is tunable so that two proper lines can be found. The rest of the clock is a complex system of servo loops and noise cancelation schemes described in the schematic shown below.
Nonlinear photonic crystals: parametric amplification and single photon generation
Nonlinear photonic crystal waveguides are compact efficient devices which enable a large number of functionalities. Nonlinear operation requires a material with no nonlinear losses, at 1550 nm, the best material is InGaP.

The figure on the left shows SEM images of the PhC membrane waveguide including a sharp mode matching input facet.The sequence of holes is used to control the dispersion of the waveguide. Shown are a simple waveguide with a monotonic dispersion and a dispersion engineered waveguide with a complex dispersion curve.
Results of parametric interactions are shown in the figures below.
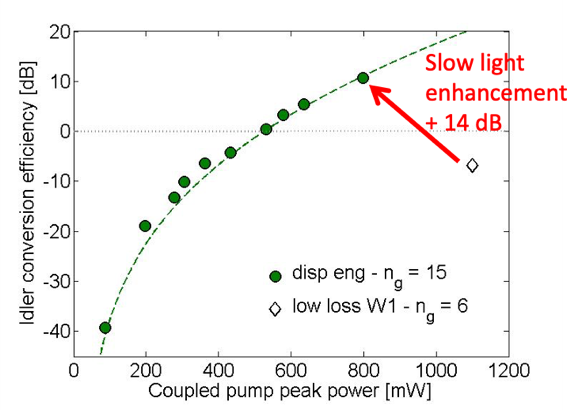
A 1 mm long waveguide, pumped at a peak power of 800 mW induces a record parametric gain of 14 dB.
Narrow band FWM occurs when the pump is in the normal dispersion regime.
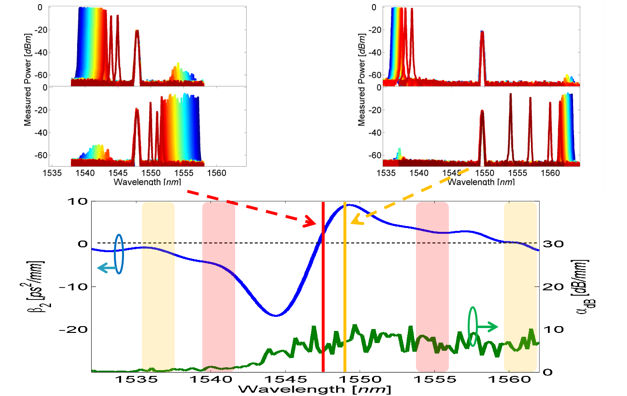 It defines two phase matching regions Which are placed far from the pump.
These waveguides enable also phase sensitive parametric amplification as shown in the figure below.